
Explore Jefferson County Map Resources
Access detailed maps and tools designed to enhance understanding of Jefferson County’s geography and environment.

ArcGIS Web Viewer
Interact with the official ArcGIS platform for up-to-date geographic information.

FLOOD & DROUGHT
MONITORING IN MISSOURI
Web and Smartphone based apps for notifications of flood conditions.
Discover Valuable Learning Materials
How to Use the Jefferson County, MO ArcGIS Flood Map
Welcome to your quick guide to exploring the Jefferson County Flood Mapping Tools, including the county’s ArcGIS web app and Missouri’s hydrology dashboards.
These interactive maps help you see floodplains, water features, elevations, and flood risk areas across the county — useful for homeowners, planners, and residents concerned about flooding.
📍 1. Open the Map
Jefferson County Flood Map App
👉 https://jeffersoncomo.maps.arcgis.com/apps/webappviewer/index.html?id=7052c8ec5a434e598c83a4a02146124c
This is a public ArcGIS Web AppViewer map — you don’t need an account to view it. When it loads, you’ll see the main map canvas showing geography and layers such as flood plains, roads, parcels, etc.
🔍 2. Basic Navigation
🖱️ Pan & Zoom
- Click and drag the map to move around.
- Scroll wheel or use the + / – controls to zoom in or out.
Classic map tools like these let you focus on your neighborhood or the entire county.
🔎 Search for an Address
- Some viewers offer a search box where you can type an address or place name.
Use this to jump directly to the location you’re interested in.
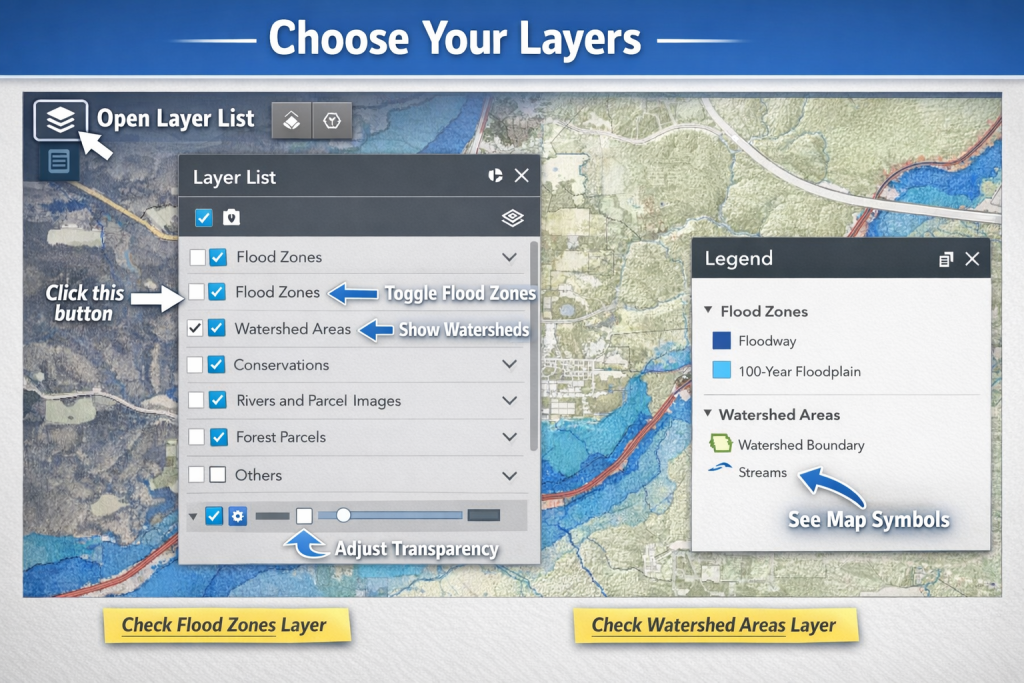
📊 3. Layers & Legend
Maps are built from layers — each layer shows a type of data (e.g., floodplain boundaries or property parcels).
🧭 Look for a Layers or Contents button (often in a side panel).
- Turn layers on/off to simplify the view.
- Layers may include flood zones, watercourses, roads, and parcel lines.
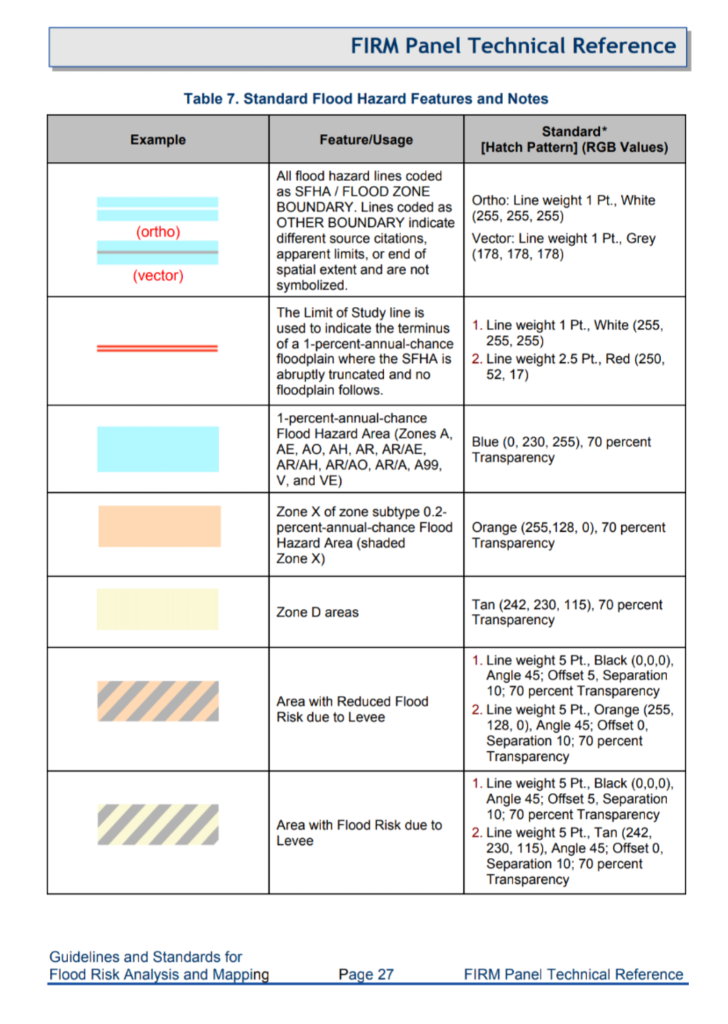
📑 The Legend explains what each symbol or color means — very useful if you’re checking flood risk zones.
4. Interact with Map Features
Click on features on the map — like flood boundaries or parcels — to bring up pop-ups with detailed info, such as:
- Flood zone designation
- Parcel number
- Elevation data (if included)
These pop-ups help you understand what you’re looking at without guessing.
🏞️ 5. Floodplain & Flood Risk Information
In addition to the county web map:
Missouri Hydrology Information Center (MoHIC)
👉 https://mohic.mo.gov/
This dashboard from the Missouri Department of Natural Resources provides statewide tools, including:
- streamgage monitoring
- soil moisture mapping
- flood inundation mapping
- LiDAR and imagery resources to view hydrology data statewide
These features can supplement local maps with broader environmental context.
📚 External Resources & Tutorials
If you want to go beyond basic navigation, here are excellent official guides and tutorials:
📘 Official ArcGIS Tutorials
- ArcGIS Get Started with Map Viewer – Learn how to pan, zoom, explore layers, and use toolbars.
- ArcGIS Mapping Basics (YouTube) – A beginner video on making and navigating web maps.
🧭 Jefferson County GIS Data & Maps Hub
📌 https://www.jeffcomo.gov/168/GIS-Data-Maps — Links to parcel, floodplain, road, and other county GIS resources.
📍 Federal Flood Maps
📌 Jefferson County FEMA Flood Maps — Official FEMA flood hazard data.
⚡ Quick Tips
- Hide layers you don’t need to declutter the map.
- Use search or zoom tools to focus on a specific property.
- View pop-ups for information instead of guessing what colors/symbols mean.
- Many maps auto-save your zoom level — so you can share a link and people see the same view.
📌 Summary
With these tips:
✔ You can explore the Jefferson County ArcGIS flood map
✔ View floodplain and other layers
✔ Access Missouri flood data via MoHIC
✔ Use official tutorials for deeper GIS understanding
Whether you’re trying to avoid flood-prone areas or researching property risk, these free interactive maps are your best tool.
Understanding Jefferson County Maps
Explore how to navigate and utilize the ArcGIS tools to access vital geographic and environmental data for Jefferson County.

Step One: Access Interactive Maps
Begin by visiting the ArcGIS Web App Viewer and Missouri Heritage Information Center for comprehensive mapping resources tailored to the Rock Creek Watershed.

Step Two: Explore Features
Learn to use map layers, search functions, and resource links to gather detailed environmental and community information effectively.

Step Three: Utilize Resources
Discover how to apply the detailed guide to maximize your experience and support local environmental awareness and engagement.
Take the First Step Toward Your Success Today
This section encourages visitors to take action, such as signing up, subscribing, or learning more about your services. It highlights the benefits of taking the next step and offers clear instructions for engagement.